Yoghurt
Temperatures
Composition
More information from other databases:
| Sector | Emission | |
|---|---|---|
| Agriculture | 1.53 kg C02/kg | 72.9% |
| Processing | 0.15 kg C02/kg | 7.1% |
| Packaging | 0.18 kg C02/kg | 8.6% |
| Transport | 0.2 kg C02/kg | 9.5% |
| Retail & distribution | 0.04 kg C02/kg | 1.9% |
| Consumption | 0.01 kg C02/kg | 0.5% |
| 2.1 kg C02/kg | 100% | |
Quality criteria
| Name | Initial value | Units | Source |
|---|---|---|---|
| Evident spoilage | 10 | Mataragas et al., 2008, . Quantifying the spoilage and shelf-life of yoghurt with fruits, Food Microbiology, 28:611-616 |
Product
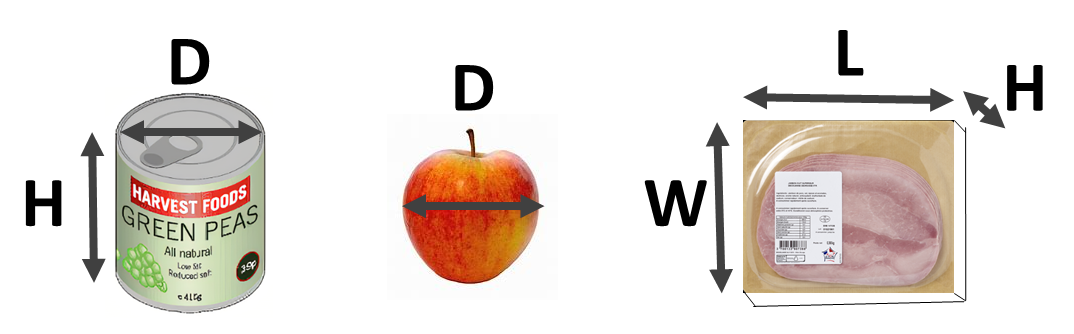
Primary packaging
| Weight of this packaging: | 0.007162831250184729 kg |
| Emission due to this packaging: | 125 g CO2e / kg of product |
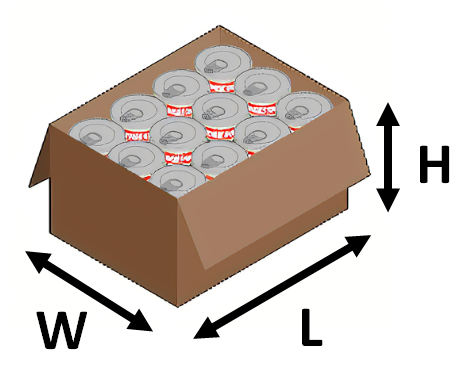
Secondary packaging
| Weight of this packaging: | 0.012400000000000003 kg |
| 16 products / primary packages | Estimated total weight: 2.13 kg |
| Emission due to this packaging: | 5 g CO2e / kg of product |
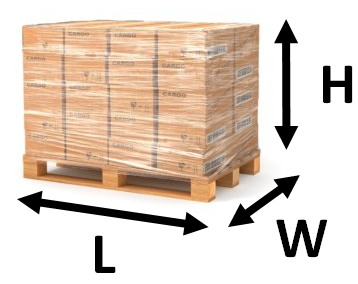
Tertiary packaging
| Weight of this packaging: | 0.0792 kg |
| 7680 products / primary packages | Estimated total weight: 1021.04 kg |
| Emission due to this packaging: | 0 g CO2e / kg of product |